[Jeus] GC(Garbage Collection, 가비지 컬렉션)를 분석하는 방법
이 글을 보고 계시다면 제우스를 운영하면서 “stop-the-world” 현상으로 인해 Heap Dump를 경험한 운영자일 것입니다. 아래 두 가지 방법으로 GC를 분석할 수 있습니다.
- jstat 명령어 사용
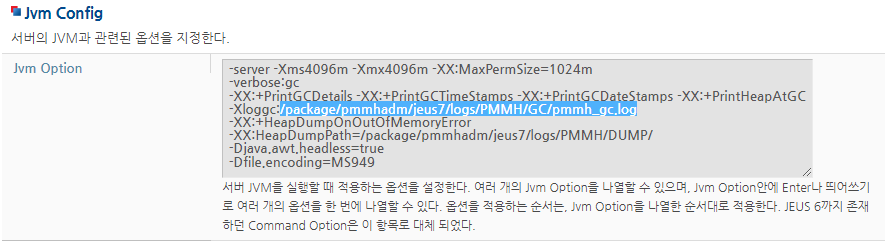
- GC 로그 확인: Jvm 옵션에서 GC 로그 경로 확인
jstat 명령어를 사용해서 GC를 분석하는 방법을 알아보겠습니다.
먼저 jsp -m 명령어를 사용해서 Java로 실행된 프로세스를 확인합니다(ps 명령어로도 확인 가능). 분석이 필요한 Managed Server의 프로세스ID를 확인합니다. 저는 PMMH(3267)를 확인할 예정입니다.
$ jps -m1442 ServerBootstrapper -domain pmmhadm -server CSMD -u administrator
3267 ServerBootstrapper -domain pmmhadm -server PMMH -u administrator
972 NodemanagerBootstrapper
31825 DomainAdminServerBootstrapper -domain pmmhadm -server adminServer -u administrator
30866 ServerBootstrapper -domain pmmhadm -server PMMI -u administrator
26269 Jps -m
1861 ServerBootstrapper -domain pmmhadm -server PMMK -u administrator
jstat [-gc | -gcutil | -gccause ] [-h 숫자] pid [interval [count]] 명령어로 실시간 GC 현황을 모니터링합니다.
-gc : 각 힙(heap) 영역의 현재 크기와 현재 사용량(Eden 영역, Survivor 영역, Old 영역등), 총 GC 수행 횟수, 누적 GC 소요 시간을 보여 준다.
-gcutil : 각 힙 영역에 대한 사용 정도를 백분율로 보여 준다. 아울러 총 GC 수행 횟수와 누적 GC 시간을 알 수 있다.
-gccause : -gcutil 옵션이 제공하는 정보와 함께 마지막 GC 원인과 현재 발생하고 있는 GC의 원인을 알 수 있는 정보를 보여 준다.
-h 숫자 : 지정된 “숫자” 만큼의 레코드마다 헤더 출력
interval : 출력되는 레코드의 시간 간격 지정(미리 second)
count : 출력되는 레코드 갯수 지정
$ jstat -gc -h5 3267 1000 10S0C     S1C     S0U   S1U    EC        EU       OC          OU        PC      PU         YGC   YGCT    FGC    FGCT     GCT
50688.0 6144.0  0.0   5632.7 1298944.0 680221.9 2796544.0   145400.0  77312.0 76457.1    273   12.504  141    35.829   48.333
50688.0 6144.0  0.0   5632.7 1298944.0 680577.0 2796544.0   145400.0  77312.0 76457.1    273   12.504  141    35.829   48.333
50688.0 6144.0  0.0   5632.7 1298944.0 680849.8 2796544.0   145400.0  77312.0 76457.1    273   12.504  141    35.829   48.333
50688.0 6144.0  0.0   5632.7 1298944.0 682163.6 2796544.0   145400.0  77312.0 76457.1    273   12.504  141    35.829   48.333
50688.0 6144.0  0.0   5632.7 1298944.0 682163.6 2796544.0   145400.0  77312.0 76457.1    273   12.504  141    35.829   48.333
S0C     S1C     S0U   S1U    EC        EU       OC          OU        PC      PU         YGC   YGCT    FGC    FGCT     GCT
50688.0 6144.0  0.0   5632.7 1298944.0 682732.9 2796544.0   145400.0  77312.0 76457.1    273   12.504  141    35.829   48.333
50688.0 6144.0  0.0   5632.7 1298944.0 682814.4 2796544.0   145400.0  77312.0 76457.1    273   12.504  141    35.829   48.333
50688.0 6144.0  0.0   5632.7 1298944.0 683090.8 2796544.0   145400.0  77312.0 76457.1    273   12.504  141    35.829   48.333
50688.0 6144.0  0.0   5632.7 1298944.0 683555.6 2796544.0   145400.0  77312.0 76457.1    273   12.504  141    35.829   48.333
50688.0 6144.0  0.0   5632.7 1298944.0 683830.8 2796544.0   145400.0  77312.0 76457.1    273   12.504  141    35.829   48.333
| 컬럼 | 설명 |
|---|---|
| S0C | Survivor 0 영역의 현재 크기를 KB 단위로 표시 |
| S1C | Survivor 1 영역의 현재 크기를 KB 단위로 표시 |
| S0U | Survivor 0 영역의 현재 사용량을 KB 단위로 표시 |
| S1U | Survivor 1 영역의 현재 사용량을 KB 단위로 표시 |
| EC | Eden 영역의 현재 크기를 KB 단위로 표시 |
| EU | Eden 영역의 현재 사용량을KB 단위로 표시 |
| OC | Old 영역의 현재 크기를 KB 단위로 표시 |
| OU | Old 영역의 현재 사용량을KB 단위로 표시 |
| PC | Permanent 영역의 현재 크기를 KB 단위로 표시 |
| PU | Permanent 영역의 현재 사용량을KB 단위로 표시 |
| YGC | Young Generation의 GC 이벤트 발생 횟수 |
| YGCT | Yong Generation의 GC 수행 누적 시간 |
| FGC | Full GC 이벤트가 발생한 횟수 |
| FGCT | Full GC 수행 누적 시간 |
| GCT | 전체 GC 수행 누적 시간 |
$ jstat -gccause -h5 3267 1000 10S0      S1    E       O     P        YGC   YGCT     FGC   FGCT     GCT    LGCC                 GCC
 84.77   0.00  93.63   5.22  98.91    274   12.601   141   35.829   48.431 Allocation Failure   No GC
 84.77   0.00  93.63   5.22  98.91    274   12.601   141   35.829   48.431 Allocation Failure   No GC
 84.77   0.00  94.86   5.22  98.91    274   12.601   141   35.829   48.431 Allocation Failure   No GC
 84.77   0.00  96.12   5.22  98.91    274   12.601   141   35.829   48.431 Allocation Failure   No GC
 84.77   0.00  96.13   5.22  98.91    274   12.601   141   35.829   48.431 Allocation Failure   No GC
 S0      S1    E       O     P        YGC   YGCT     FGC   FGCT     GCT    LGCC                 GCC
 84.77   0.00  96.13   5.22  98.91    274   12.601   141   35.829   48.431 Allocation Failure   No GC
 84.77   0.00  96.15   5.22  98.91    274   12.601   141   35.829   48.431 Allocation Failure   No GC
 84.77   0.00  96.18   5.22  98.91    274   12.601   141   35.829   48.431 Allocation Failure   No GC
 84.77   0.00  96.64   5.22  98.91    274   12.601   141   35.829   48.431 Allocation Failure   No GC
 84.77   0.00  96.84   5.22  98.91    274   12.601   141   35.829   48.431 Allocation Failure   No GC
| 컬럼 | 설명 |
|---|---|
| S0 | Survivor 0 영역의 현재 사용률(&) |
| S1 | Survivor 1 영역의 현재 사용률(%) |
| E | Eden 영역의 현재 사용률(%) |
| O | Old 영역의 현재 사용률(%) |
| P | Permanent 영역의 현재 사용률(%) |
| LGCC | 지난 GC의 발생 이유 |
| GCC | 현재 GC의 발생 이유 |
GC 로그를 분석하는 방법을 알아보겠습니다.
Managed Server PMMH의 GC 로그 경로는 /package/pmmhadm/jeus7/logs/PMMH/GC/입니다. 아래는 GC 로그는 분석 방법을 설명하기 위해 일부를 발췌한 내용입니다.
- Young GC를 방식하는 방법
– “full 140″는 140번째의 full GC를 의미하며, 숫자 변경되지 않은 GC는 Young GC입니다.{Heap before GC invocations=409 (full 140): PSYoungGen total 1359360K, used 1341277K [0x00000007aaa80000, 0x0000000800000000, 0x0000000800000000) eden space 1319936K, 100% used [0x00000007aaa80000,0x00000007fb380000,0x00000007fb380000) from space 39424K, 54% used [0x00000007fd980000,0x00000007fee574a0,0x0000000800000000) to space 38912K, 0% used [0x00000007fb380000,0x00000007fb380000,0x00000007fd980000) ParOldGen total 2796544K, used 104424K [0x00000006fff80000, 0x00000007aaa80000, 0x00000007aaa80000) object space 2796544K, 3% used [0x00000006fff80000,0x000000070657a2a8,0x00000007aaa80000) PSPermGen total 76800K, used 76420K [0x00000006bff80000, 0x00000006c4a80000, 0x00000006fff80000) object space 76800K, 99% used [0x00000006bff80000,0x00000006c4a21118,0x00000006c4a80000) 2024-05-13T07:20:46.374+0900: 503048.419: [GC [PSYoungGen: 1341277K->10205K(1330176K)] 1445701K->118755K(4126720K), 0.0187490 secs] [Times: user=0.03 sys=0.00, real=0.02 secs] Heap after GC invocations=409 (full 140): PSYoungGen total 1330176K, used 10205K [0x00000007aaa80000, 0x0000000800000000, 0x0000000800000000) eden space 1319936K, 0% used [0x00000007aaa80000,0x00000007aaa80000,0x00000007fb380000) from space 10240K, 99% used [0x00000007fb380000,0x00000007fbd777b0,0x00000007fbd80000) to space 40448K, 0% used [0x00000007fd880000,0x00000007fd880000,0x0000000800000000) ParOldGen total 2796544K, used 108549K [0x00000006fff80000, 0x00000007aaa80000, 0x00000007aaa80000) object space 2796544K, 3% used [0x00000006fff80000,0x00000007069814c8,0x00000007aaa80000) PSPermGen total 76800K, used 76420K [0x00000006bff80000, 0x00000006c4a80000, 0x00000006fff80000) object space 76800K, 99% used [0x00000006bff80000,0x00000006c4a21118,0x00000006c4a80000) } {Heap before GC invocations=410 (full 140): PSYoungGen total 1330176K, used 1325792K [0x00000007aaa80000, 0x0000000800000000, 0x0000000800000000) eden space 1319936K, 99% used [0x00000007aaa80000,0x00000007faf40b50,0x00000007fb380000) from space 10240K, 99% used [0x00000007fb380000,0x00000007fbd777b0,0x00000007fbd80000) to space 40448K, 0% used [0x00000007fd880000,0x00000007fd880000,0x0000000800000000) ParOldGen total 2796544K, used 108549K [0x00000006fff80000, 0x00000007aaa80000, 0x00000007aaa80000) object space 2796544K, 3% used [0x00000006fff80000,0x00000007069814c8,0x00000007aaa80000) PSPermGen total 76800K, used 76437K [0x00000006bff80000, 0x00000006c4a80000, 0x00000006fff80000) object space 76800K, 99% used [0x00000006bff80000,0x00000006c4a257d8,0x00000006c4a80000) 2024-05-13T07:37:24.019+0900: 504046.063: [GC [PSYoungGen: 1325792K->11823K(1356800K)] 1434341K->120764K(4153344K), 0.0204200 secs] [Times: user=0.03 sys=0.00, real=0.02 secs] Heap after GC invocations=410 (full 140): PSYoungGen total 1356800K, used 11823K [0x00000007aaa80000, 0x0000000800000000, 0x0000000800000000) eden space 1316352K, 0% used [0x00000007aaa80000,0x00000007aaa80000,0x00000007fb000000) from space 40448K, 29% used [0x00000007fd880000,0x00000007fe40bdb0,0x0000000800000000) to space 40960K, 0% used [0x00000007fb000000,0x00000007fb000000,0x00000007fd800000) ParOldGen total 2796544K, used 108941K [0x00000006fff80000, 0x00000007aaa80000, 0x00000007aaa80000) object space 2796544K, 3% used [0x00000006fff80000,0x00000007069e3518,0x00000007aaa80000) PSPermGen total 76800K, used 76437K [0x00000006bff80000, 0x00000006c4a80000, 0x00000006fff80000) object space 76800K, 99% used [0x00000006bff80000,0x00000006c4a257d8,0x00000006c4a80000) } - Full GC를 확인하는 방법
– full GC의 숫자가 변경되면 Full GC가 실행되었다는 것을 의미합니다.(full 140 -< full 141)
– full 141 GC로그에서 Old 영역의 현재 사용량과, 사용률이 변경되고 있는지 확인합니다. Head Dump가 발생하는 상황에서는 사용률이 100%에 가깝습니다.
– full GC시 소요된 시간은 0.22 secs입니다.{Heap before GC invocations=410 (full 140): PSYoungGen total 1330176K, used 1325792K [0x00000007aaa80000, 0x0000000800000000, 0x0000000800000000) eden space 1319936K, 99% used [0x00000007aaa80000,0x00000007faf40b50,0x00000007fb380000) from space 10240K, 99% used [0x00000007fb380000,0x00000007fbd777b0,0x00000007fbd80000) to space 40448K, 0% used [0x00000007fd880000,0x00000007fd880000,0x0000000800000000) ParOldGen total 2796544K, used 108549K [0x00000006fff80000, 0x00000007aaa80000, 0x00000007aaa80000) object space 2796544K, 3% used [0x00000006fff80000,0x00000007069814c8,0x00000007aaa80000) PSPermGen total 76800K, used 76437K [0x00000006bff80000, 0x00000006c4a80000, 0x00000006fff80000) object space 76800K, 99% used [0x00000006bff80000,0x00000006c4a257d8,0x00000006c4a80000) 2024-05-13T07:37:24.019+0900: 504046.063: [GC [PSYoungGen: 1325792K->11823K(1356800K)] 1434341K->120764K(4153344K), 0.0204200 secs] [Times: user=0.03 sys=0.00, real=0.02 secs] Heap after GC invocations=410 (full 140): PSYoungGen total 1356800K, used 11823K [0x00000007aaa80000, 0x0000000800000000, 0x0000000800000000) eden space 1316352K, 0% used [0x00000007aaa80000,0x00000007aaa80000,0x00000007fb000000) from space 40448K, 29% used [0x00000007fd880000,0x00000007fe40bdb0,0x0000000800000000) to space 40960K, 0% used [0x00000007fb000000,0x00000007fb000000,0x00000007fd800000) ParOldGen total 2796544K, used 108941K [0x00000006fff80000, 0x00000007aaa80000, 0x00000007aaa80000) object space 2796544K, 3% used [0x00000006fff80000,0x00000007069e3518,0x00000007aaa80000) PSPermGen total 76800K, used 76437K [0x00000006bff80000, 0x00000006c4a80000, 0x00000006fff80000) object space 76800K, 99% used [0x00000006bff80000,0x00000006c4a257d8,0x00000006c4a80000) } {Heap before GC invocations=411 (full 141): PSYoungGen total 1356800K, used 11823K [0x00000007aaa80000, 0x0000000800000000, 0x0000000800000000) eden space 1316352K, 0% used [0x00000007aaa80000,0x00000007aaa80000,0x00000007fb000000) from space 40448K, 29% used [0x00000007fd880000,0x00000007fe40bdb0,0x0000000800000000) to space 40960K, 0% used [0x00000007fb000000,0x00000007fb000000,0x00000007fd800000) ParOldGen total 2796544K, used 108941K [0x00000006fff80000, 0x00000007aaa80000, 0x00000007aaa80000) object space 2796544K, 3% used [0x00000006fff80000,0x00000007069e3518,0x00000007aaa80000) PSPermGen total 76800K, used 76437K [0x00000006bff80000, 0x00000006c4a80000, 0x00000006fff80000) object space 76800K, 99% used [0x00000006bff80000,0x00000006c4a257d8,0x00000006c4a80000) 2024-05-13T07:37:24.040+0900: 504046.084: [Full GC [PSYoungGen: 11823K->0K(1356800K)] [ParOldGen: 108941K->91120K(2796544K)] 120764K->91120K(4153344K) [PSPermGen: 76437K->76437K(77312K)], 0.2180630 secs] [Times: user=0.34 sys=0.00, real=0.22 secs] Heap after GC invocations=411 (full 141): PSYoungGen total 1356800K, used 0K [0x00000007aaa80000, 0x0000000800000000, 0x0000000800000000) eden space 1316352K, 0% used [0x00000007aaa80000,0x00000007aaa80000,0x00000007fb000000) from space 40448K, 0% used [0x00000007fd880000,0x00000007fd880000,0x0000000800000000) to space 40960K, 0% used [0x00000007fb000000,0x00000007fb000000,0x00000007fd800000) ParOldGen total 2796544K, used 91120K [0x00000006fff80000, 0x00000007aaa80000, 0x00000007aaa80000) object space 2796544K, 3% used [0x00000006fff80000,0x000000070587c110,0x00000007aaa80000) PSPermGen total 77312K, used 76437K [0x00000006bff80000, 0x00000006c4b00000, 0x00000006fff80000) object space 77312K, 98% used [0x00000006bff80000,0x00000006c4a25798,0x00000006c4b00000) }
아래 글은 Naver D2 블로그의 링크입니다. NAVER 개발자들이 직접 정리한 실전 개발 경험과 지식이 담겨진 블로그인데 GC를 이해하는데 큰 도움이 될 것입니다.